


Through the end of August, 2,922 homes have closed in Washington County this year against 2,926 over the same stretch of 2025. That is a difference of four sales out of nearly three thousand. Every month in between has looked dramatic, and August looked worse than most: the median sale price fell 2.7 percent, closings dropped almost 18 percent, and the typical home took four days longer to sell. Line the two years up and they are close to a tie. Here is what August actually did, and the single price band that explains most of it.
Update, October 5, 2026. The August sales count in this report was a floor rather than a final number. I counted 295 closed sales on September 1, and the MLS now shows 349 for August 2026, which is down 2.8 percent from 359 in August 2025 and not the drop of almost 18 percent I reported here. Closings keep getting entered for days after a month ends, so I now recheck the prior month before I publish. The Federal Open Market Committee also raised its target range to 3.75 to 4.00 percent on September 16, 2026, so the statement below that the range had not changed in 2026 no longer holds. Read the September 2026 report for the settled figures.
What August 2026 actually did
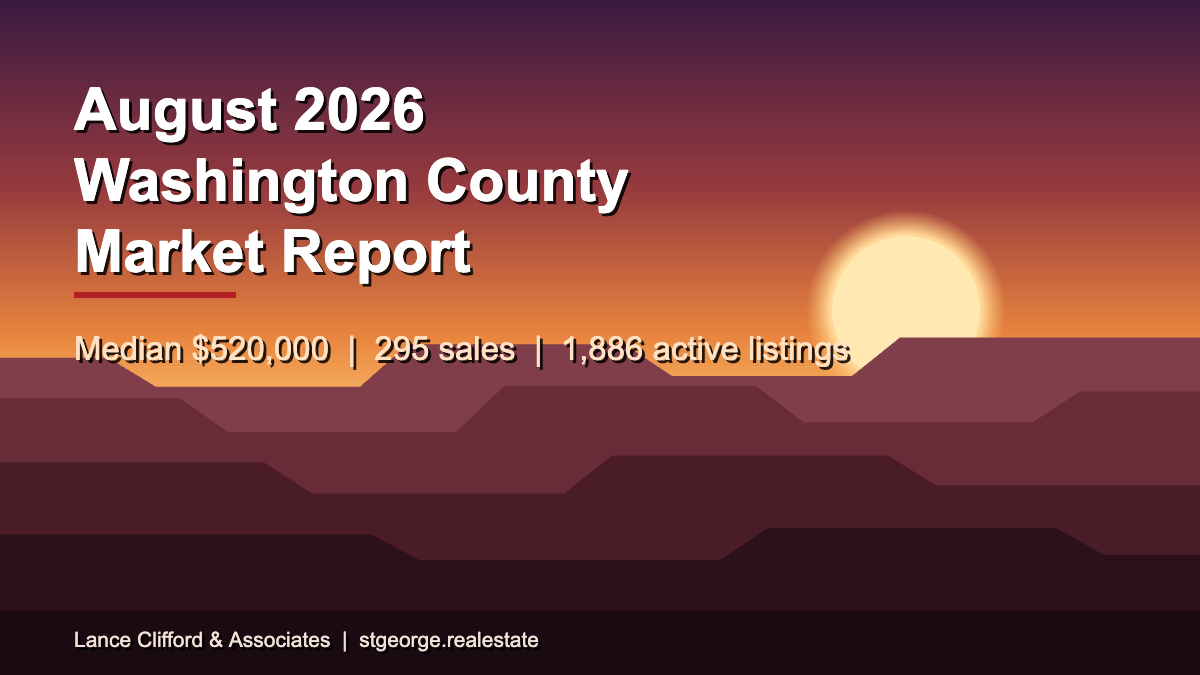
The median sale price in Washington County, Utah was $520,000 in August 2026, down 2.7 percent from $534,250 in August 2025, and 295 homes closed against 359 a year earlier. Every county figure in this post comes from the Washington Residential market summary I pulled from the MLS on September 1, 2026, and each one is a full-month August number rather than a rolling average.
Two things fell together this month, which is a different picture from July. In July the median rose while sales fell, and the top of the market carried the county. August reversed that. The average sale price slid harder than the median, from $664,447 to $635,895, and that spread between the two is usually a sign that expensive homes sat out the month rather than that the whole market repriced.
| Metric | August 2026 | August 2025 | Change |
|---|---|---|---|
| Median sale price | $520,000 | $534,250 | Down 2.7% |
| Average sale price | $635,895 | $664,447 | Down 4.3% |
| Homes closed | 295 | 359 | Down 17.8% |
| New listings | 577 | 587 | Down 1.7% |
| Active listings | 1,886 | 1,807 | Up 4.4% |
| Median days on market | 53 | 49 | Up 4 days |
| Absorption rate | 5.21 months | 5.24 months | Almost flat |
Source: Washington Residential market summary, Washington County MLS, prepared September 1, 2026.
One price band grew, and every other band shrank
Homes priced from $400,000 to $499,999 were the only part of the Washington County market that sold more in August 2026 than in August 2025. That band closed 77 sales against 55 a year earlier, an increase of 40 percent, while every band above and below it fell. This is the finding that makes the rest of the month make sense, and it is the reason the median came down without anything alarming happening to values.
| Price band | August 2026 sales | August 2025 sales | Change |
|---|---|---|---|
| Under $400,000 | 57 | 92 | Down 38% |
| $400,000 to $499,999 | 77 | 55 | Up 40% |
| $500,000 to $749,999 | 98 | 136 | Down 28% |
| $750,000 to $999,999 | 31 | 33 | Down 6% |
| $1,000,000 and up | 32 | 43 | Down 26% |
Source: Washington Residential market summary, Washington County MLS, prepared September 1, 2026. Bands are combined from the report's sixteen published price ranges and total 295 sales for 2026 and 359 for 2025.
Read across that table and the median almost has to fall. Sales below $400,000 dropped by 35 transactions while sales in the $400,000s picked up 22, so the middle of the distribution slid down into the $400Ks rather than out of the market. Share matters as much as count here: 134 of August's 295 sales closed under $500,000, which is 45 percent of the month, against 41 percent a year ago. More of what sold was cheaper. That is a mix change, not a price cut, and the two get confused constantly.
Why the average fell harder than the median
The average sale price fell 4.3 percent while the median fell 2.7 percent, and the reason sits at the top of the market. Thirty-two homes closed at $1,000,000 or more in August 2026 against 43 in August 2025, a drop of 26 percent. When high-price sales thin out, the average drops faster than the median because the average is the number those sales were holding up.
What makes this worth watching is that the luxury inventory did not thin out with it. There were 379 active listings priced at $1,000,000 or more at the end of August, which is 20 percent of all 1,886 active listings in the county. Meanwhile $1M-plus homes were only 11 percent of August's closed sales. A year ago that inventory share was 18 percent and the sales share was 12 percent, so the gap between how much expensive inventory is standing and how much of it is moving got wider on both sides at once.
The asking side tells the same story from the other direction. The average list price across active listings rose 6.6 percent year over year to $855,921 while the average sale price fell 4.3 percent. Sellers at the high end are asking more and closing less often. If you own something in that range, that is the number to sit with. I rebuild the St. George market summary page every month with the current standing inventory by community. The current version is here.
The gap between what sellers ask and what buyers pay
The median asking price across active listings was $602,308 at the end of August 2026. The median price that actually closed was $520,000. That is a gap of $82,308, or about 16 percent, and it is the most useful single comparison on the whole report.
It does not mean every home is overpriced by 16 percent. Part of the gap is real: the inventory standing on the market genuinely skews to larger and more expensive homes than the mix that sells in a given month, which is exactly what the price band table showed. But part of it is aspirational pricing that has not met the market yet, and the days on market figures show it. Half of August's closings went under contract within 53 days, up from 49 last August. The average was 77 days, down from 80. The typical sale is taking longer while the very slowest listings are clearing a little faster than they did a year ago.
Absorption sat at 5.21 months, against 5.24 months last August. Six months is the rough dividing line between a market that favors sellers and one that favors buyers, so Washington County is sitting a little on the seller side of neutral and has been for a year. Nothing in August moved that. If you want to see what a specific sale would net you after title, escrow and recording, my closing cost calculator runs the real numbers off the filed rate schedules. Open the closing cost calculator.
What mortgage rates did in August
Mortgage rates did almost nothing in August 2026. Freddie Mac's Primary Mortgage Market Survey put the 30-year fixed average at 6.69 percent on August 6, 6.67 percent on August 13, 6.65 percent on August 20, and 6.66 percent on August 27. That is a four basis point band across the entire month. The most recent reading, released September 3, 2026, was 6.71 percent on the 30-year and 6.04 percent on the 15-year.
The Federal Open Market Committee meets September 15 and 16, 2026, and I get asked every time what that will do to mortgage rates. The honest answer is that the two move on different things. The federal funds target range has been 3.50 to 3.75 percent since the committee cut it on December 11, 2025, and it has not changed once in 2026. Over that same stretch, Freddie Mac's 30-year average ran from 5.98 percent in late February to 6.71 percent last week. The Fed held perfectly still and the mortgage rate moved 73 basis points anyway. Anyone telling you what the September meeting will do to your rate is guessing.
How Washington County compares to the country
The National Association of Realtors reported a national median existing-home price of $434,100 for July 2026 in its August 11, 2026 release, up 2 percent year over year, with 4.6 months of supply and a median 29 days on market. The August national figures are scheduled for release on September 10, 2026, three days after this post.
Washington County's August median of $520,000 runs about 20 percent above that national July figure, and our homes take substantially longer to sell: 53 median days here against 29 nationally. Compare those two numbers carefully, though. They are different months and the days-on-market measures are not built the same way, so treat this as a rough sense of scale rather than a clean head-to-head. The useful takeaway is that Southern Utah is a more expensive and slower market than the national average, and it has been for years.
What is not published yet, and what I can give you instead
City-level August closed medians for St. George, Washington City, Hurricane, Ivins and Santa Clara are not published anywhere as of September 7, 2026. I checked the Washington County Board of REALTORS housing statistics page, the Utah Association of REALTORS statistics page, and bestutahrealestate.com, and the most recent month any of them shows is July. Rather than estimate a number, I am telling you it does not exist yet.
What I can give you is the asking side, counted this morning from my own MLS feed on September 7, 2026. Washington County has 3,326 active and pending houses and condos right now, of which 900 sit inside St. George city limits. Those counts include pending sales, so they run higher than the 1,886 active listings the August report shows.
Washington County: August 2026 in six numbers (MLS market summary, prepared September 1, 2026)
- Median sale price: $520,000, down 2.7 percent from August 2025
- Sales: 295 closings, down 17.8 percent from 359
- Year to date: 2,922 closings against 2,926 last year, a gap of four sales
- Inventory: 1,886 active listings, up 4.4 percent, 5.21 months of absorption
- Time to sell: 53 median days on market, up from 49
- The outlier: the $400,000 to $499,999 band grew 40 percent while every other band fell
If you are selling this fall
The $400,000 to $500,000 band is where the buyers were in August, and if your home lands anywhere near it you are in the most active part of this market. Price it into that band honestly rather than reaching for the $500,000s and hoping, because the $500,000 to $749,999 range lost 28 percent of its volume year over year and that is where the reaching lands you.
Above $1,000,000 the math is harder. A fifth of the county's standing inventory is priced there and roughly a tenth of monthly sales happen there, which means the average luxury listing is competing with more homes for fewer buyers than it was a year ago. That does not mean you cannot sell. It means the first three weeks of pricing matter more than they used to, and it means preparation and photography carry more weight when a buyer has 379 alternatives. My page for sellers walks through what I actually do differently at that price point. Read it here.
If you are buying this fall
You have 1,886 active listings to choose from, up 4.4 percent from a year ago, and sellers are waiting a median of 53 days for an offer. That combination gives you room to inspect properly, ask for repairs, and walk away from a house that does not fit. It is not 2021 and it is not a distressed market either. It is a market where patience is rewarded and where a well-supported offer below asking gets a serious conversation more often than it did two years ago.
Where you look changes the math considerably. Condos and townhomes remain the entry point in most of the county. Builders are still moving standing inventory, which is worth checking against resale before you rule it out. Buyers over 55 have their own set of communities with their own fee structures and their own rules. And if you are weighing a build rather than a purchase, lots and land is its own market with its own pricing. Here are the current feeds for each:
- St. George homes for sale
- St. George condos and townhomes
- New construction in St. George
- 55+ and retirement communities
- Lots and land in St. George
One more piece of arithmetic worth running before you commit: property taxes vary more between Washington County cities than most buyers expect, and a public infrastructure district can add a full percentage point to the rate. My property tax calculator shows the bill in thirteen local tax areas side by side. Run your own number here.
Common questions
What is the median home price in Washington County, Utah?
The median sale price in Washington County was $520,000 in August 2026, down 2.7 percent from $534,250 in August 2025. Year to date through August, the median is $527,900 across 2,922 closed sales. These figures come from the Washington Residential market summary pulled from the Washington County MLS on September 1, 2026.
Are home prices falling in St. George, Utah in 2026?
No, not on the year. The August median fell 2.7 percent against August 2025, but the year to date median is $527,900 against $525,000 over the same period last year, an increase of about half a percent. Monthly medians in a county this size swing on which price bands happen to close, and in August the $400,000 to $499,999 band grew 40 percent while every other band shrank, which pulled the middle of the distribution down without values falling underneath it.
Is Washington County a buyer's market or a seller's market right now?
It is closer to balanced than either label suggests. Absorption ran 5.21 months in August 2026, almost identical to 5.24 months in August 2025, and six months is the usual dividing line between the two. The county sits slightly on the seller side of neutral while giving buyers real selection, with 1,886 active listings at the end of August and a median 53 days on market.
How long does it take to sell a house in Washington County, Utah?
Half of August 2026 closings went under contract within 53 days, up from 49 days in August 2025. The average was 77 days, down from 80 a year earlier. The median rising while the average fell means the typical sale slowed down slightly while the slowest listings cleared faster than they did last year.
Will the September 2026 Federal Reserve meeting lower mortgage rates?
Nobody can promise that, and the two rates are not the same instrument. The federal funds target range has been 3.50 to 3.75 percent since December 11, 2025, and has not changed in 2026, while Freddie Mac's 30-year average moved from 5.98 percent in late February 2026 to 6.71 percent on September 3, 2026. The Federal Open Market Committee meets September 15 and 16, 2026, and mortgage rates respond to the bond market rather than to the funds rate directly.
Want the numbers for your own house?
County medians are a starting point and nothing more. What your home is worth depends on your street, your finishes, your lot and what closed within half a mile of you in the last ninety days, and no monthly report can tell you that. I have sold real estate in St. George for 13 years and I am glad to run the actual comparables on your address, whether you are listing this fall or just want to know where you stand.
Call me at 435-200-5508. You can also send me a message here. Last month's numbers are in the July 2026 Washington County market report, and I publish an updated county report on the St. George market summary page at the start of every month. Both are linked here: July 2026 report and St. George market summary.