


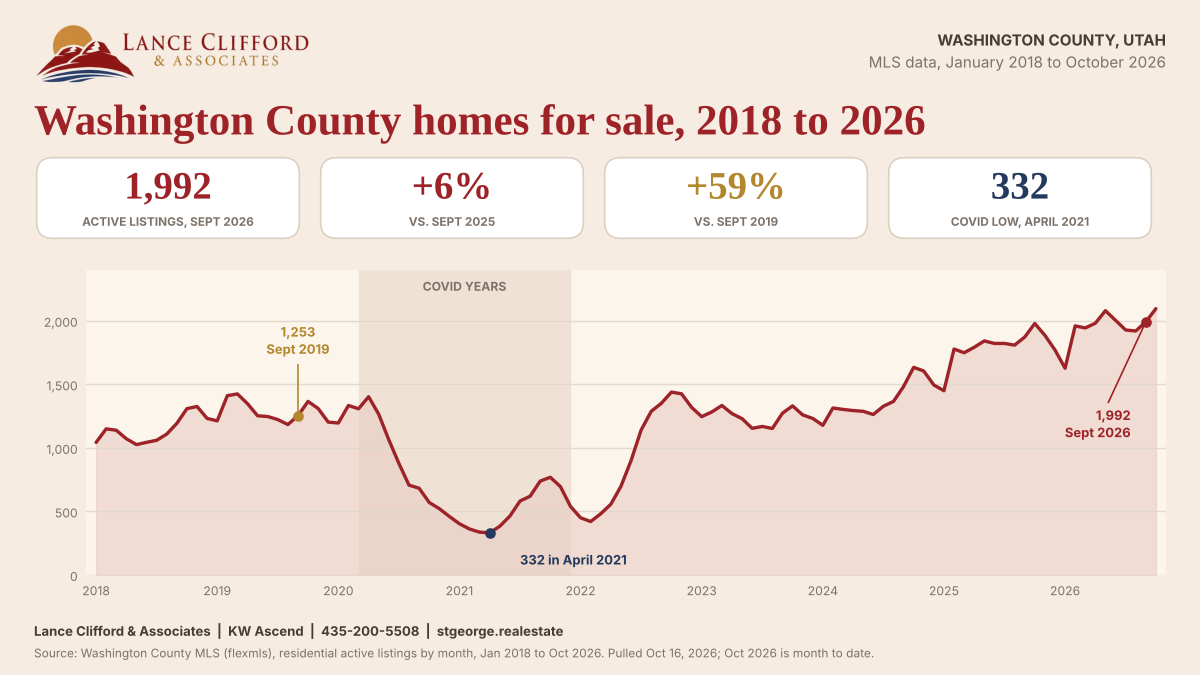
Washington County, Utah had 1,992 active residential listings in September 2026, up 6.4 percent from 1,872 in September 2025 and up 59 percent from 1,253 in September 2019, the last September before COVID. Those counts come from the Washington County MLS, which I pulled month by month on October 16, 2026, going back to January 2018. Inventory bottomed at 332 homes in April 2021, so a buyer today has six times as many homes to look at as a buyer did in the tightest month of the pandemic.
How many homes are for sale in St. George, Utah right now?
The Washington County MLS counted 1,992 active residential listings in September 2026, and a live search I ran on October 16, 2026 returned 2,085. Residential here means houses, condos, townhomes and manufactured homes across the whole county, so St. George, Washington City, Hurricane, Ivins, Santa Clara and the smaller towns are all in it. The October number is a snapshot partway through the month, which is why the comparisons below use September, the last full month.
One housekeeping note, because I would rather you hear it from me. My September market report quoted 1,974 active listings from the export I ran on the night of September 30. The same month reads 1,992 in the MLS statistics today. Listing counts get revised after the fact the same way closing counts do, and the difference is under 1 percent. Every figure in this post comes from the October 16 pull so the years compare to each other on the same footing.
What happened to inventory during COVID?
Washington County went from 1,403 active listings in April 2020 to 332 in April 2021, a drop of 76 percent in twelve months. The count fell every single month from May 2020 through April 2021, and the absorption rate bottomed at 0.70 months in April 2021. That means the entire inventory would have sold in about three weeks if nobody listed another house.
New listings did not dry up the way people remember. From January through September 2020, 5,082 homes came on the market, which is only 2 percent fewer than the same months of 2019. What changed was the buying: 4,101 homes closed in those nine months of 2020 against 3,688 in 2019, up 11 percent. Inventory collapsed because buyers showed up in force while sellers kept listing at close to their normal pace.
When did inventory get back to pre-COVID levels?
September 2022 was the first September above 2019, at 1,351 active listings against 1,253. Inventory more than doubled from April 2022 to October 2022, from 557 to 1,439, as mortgage rates climbed and closings fell off. Then it leveled out and actually dipped in 2023. September 2023 closed at 1,273. The steady climb to where we are now started in 2024.
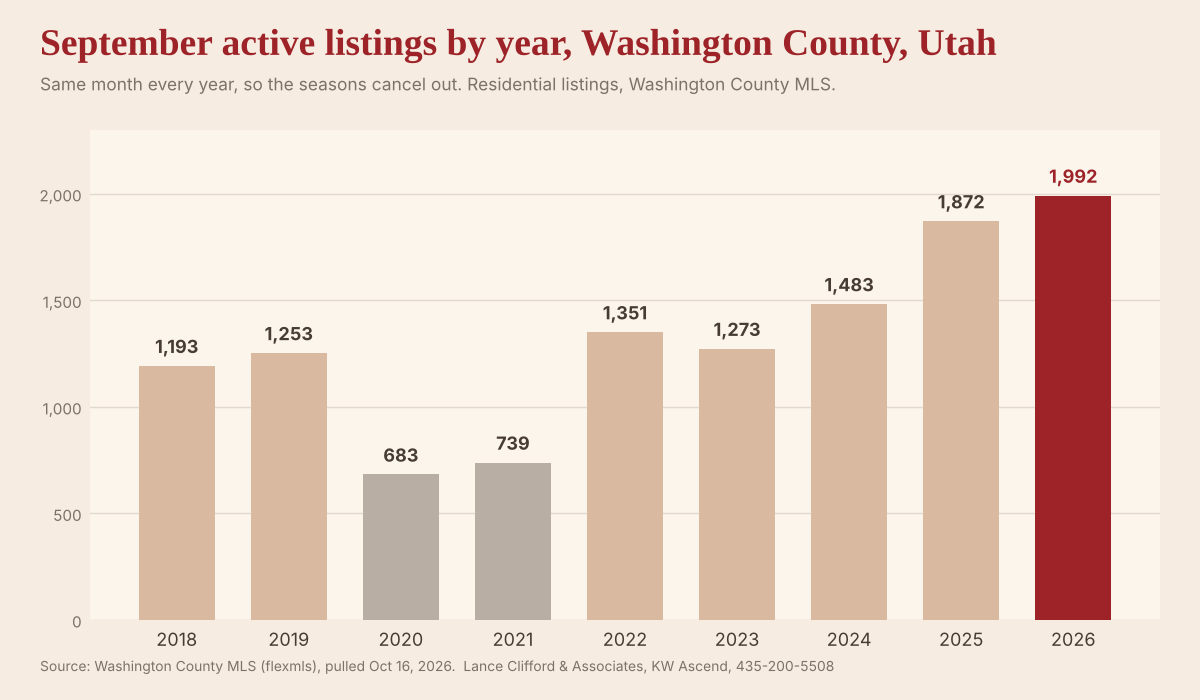
| Year | Active listings, September | Change from prior September | New listings, Jan to Sept | Closed sales, Jan to Sept | Absorption, September |
|---|---|---|---|---|---|
| 2018 | 1,193 | Not compared | 4,826 | 3,519 | 3.07 months |
| 2019 | 1,253 | Up 5.0% | 5,189 | 3,688 | 3.21 months |
| 2020 | 683 | Down 45.5% | 5,082 | 4,101 | 1.61 months |
| 2021 | 739 | Up 8.2% | 4,772 | 3,912 | 1.62 months |
| 2022 | 1,351 | Up 82.8% | 5,033 | 3,229 | 3.49 months |
| 2023 | 1,273 | Down 5.8% | 4,506 | 2,925 | 4.16 months |
| 2024 | 1,483 | Up 16.5% | 4,947 | 3,101 | 4.43 months |
| 2025 | 1,872 | Up 26.2% | 5,481 | 3,248 | 5.41 months |
| 2026 | 1,992 | Up 6.4% | 5,579 | 3,311 | 5.51 months |
Source: Washington County MLS residential statistics (flexmls inventory and absorption reports), all years pulled October 16, 2026. Closed sales for September 2026 can still rise by a few percent as late closings are entered, so the 2026 total is close but not final.
Is inventory still rising in 2026?
Yes, but the climb has mostly flattened. September 2026 inventory was up 6.4 percent from September 2025, after jumps of 16.5 percent in 2024 and 26.2 percent in 2025. The reason shows up in the table: new listings from January through September ran 1.8 percent ahead of 2025 and closed sales ran 1.9 percent ahead. When supply and sales grow at the same pace, the pile of homes for sale stops growing much.
The absorption rate tells the same story. It was 5.41 months in September 2025 and 5.51 months in September 2026, close enough to call flat. After four straight years of the market loosening, that is the first real sign of it finding a level.
Is St. George, Utah a buyer's market in 2026?
It is a balanced market leaning toward buyers. Absorption was 5.51 months in September 2026, and six months is the usual dividing line between a seller's market and a buyer's market. For comparison, it was 3.21 months in September 2019 and 0.70 months in April 2021, the most competitive month in this whole data set.
A county number hides a lot, though. A well priced three bedroom in Washington City and a $1.5 million custom home in Ivins are not competing in the same market, and the higher price ranges carry more of the standing inventory. My September report found that 376 of the county's active listings were priced at $1,000,000 or more, about 19 percent of everything for sale, while only 9 percent of September's closings landed in that range. Read the September 2026 market report.
Why are there more homes for sale than before COVID?
Compared with 2019, more sellers are listing and fewer buyers are closing. From January through September 2026, 5,579 new listings hit the MLS against 5,189 in the same months of 2019, up 7.5 percent. Closed sales fell from 3,688 to 3,311, down 10.2 percent. Neither change is dramatic alone, but stacked together for several years they add up to 59 percent more homes on the market.
New construction is a big part of what is for sale. Of the 2,085 active residential listings in a search I ran on October 16, 2026, 660 carry a year built of 2025 or later, which is 32 percent. Some of those are finished spec homes and some are homes a builder has not started yet. Either way, a resale seller in a growing area is competing with builders who can offer rate buydowns and closing credits. See new construction in St. George.
Do other sources show the same trend?
Yes. Realtor.com's count for Washington County, published through the Federal Reserve Bank of St. Louis, shows 1,297 active listings in September 2019 and 2,030 in September 2026, up 57 percent, with its own low point of 254 in April 2021, the same month the MLS bottomed. Realtor.com counts listings differently than the MLS and reports a monthly average, so the numbers will never match exactly. The shape of the line is the same. See the Realtor.com series on FRED.
Washington County inventory in five numbers (Washington County MLS, pulled October 16, 2026)
- Now: 1,992 active residential listings in September 2026, up 6.4 percent from 1,872
- Before COVID: 1,253 in September 2019, so today is up 59 percent
- The low: 332 in April 2021, with 0.70 months of absorption
- Absorption: 5.51 months in September 2026 against 5.41 a year earlier
- New construction: 660 of 2,085 active listings built in 2025 or later
If you are selling
You are not competing with 332 other houses anymore. In most price ranges a buyer has real choices, and in my experience the listings that sit are almost always the ones priced off what a neighbor got in 2022. Price against what closed in the last 60 to 90 days, get the house show ready before the photos, and expect a buyer to ask for something at inspection. I wrote about why some homes still sell fast while others sit, and most of it comes down to price and condition. Read why some homes are sitting. Read how to price a home here.
If you are buying
This is the most selection Washington County has offered in the nine years of data I pulled. That gives you room to inspect properly, negotiate on repairs and walk away from a house that does not fit. It does not mean every seller is desperate. The median home that sold in September 2026 spent 37 days on the market, per my September report, so a well priced house in a popular neighborhood still moves. You have room to negotiate, just not on every house. If you are weighing a new build, compare builder incentives on the total cost of the deal, because the headline rate is the easy part to sell. Read how to compare builder incentives. Browse St. George homes for sale.
Closing costs follow filed rate schedules, and I built a calculator that runs them on a real price. Run the closing cost calculator. For the monthly numbers as they come out, the market summary page is updated every month. Open the St. George market summary.
Common questions
How many homes are for sale in St. George, Utah right now?
Washington County, Utah had 1,992 active residential listings in September 2026, and a live MLS search on October 16, 2026 returned 2,085. That count includes houses, condos, townhomes and manufactured homes across the whole county, including St. George, Washington City, Hurricane, Ivins and Santa Clara.
Is housing inventory going up in St. George, Utah?
Yes, but slowly now. September 2026 inventory was up 6.4 percent from September 2025, after rising 16.5 percent in 2024 and 26.2 percent in 2025. New listings and closed sales from January through September 2026 each ran about 2 percent ahead of 2025, which is why the climb has flattened.
How low did St. George housing inventory get during COVID?
Washington County bottomed at 332 active residential listings in April 2021, according to the Washington County MLS. The absorption rate that month was 0.70 months, meaning the entire inventory would have sold in about three weeks if no new listings came on.
Is St. George, Utah a buyer's market or a seller's market in 2026?
It is a balanced market leaning toward buyers. The absorption rate was 5.51 months in September 2026, and six months is the usual line between a seller's market and a buyer's market. In September 2019 it was 3.21 months and in April 2021 it was 0.70.
Why are there more homes for sale in St. George than before COVID?
Two things moved at once. From January through September 2026, 5,579 new listings came on the market against 5,189 in the same months of 2019, up 7.5 percent, while closed sales fell from 3,688 to 3,311, down 10.2 percent. New construction is a big share of what is for sale: 660 of 2,085 active listings on October 16, 2026 were built in 2025 or later or are still under construction.
Want to know what this means for your house?
A county inventory count is a starting point. What decides your sale is how many homes like yours are listed within a mile of you, and how long the last few took to sell. I have sold real estate in St. George for 13 years and I am happy to pull that for your address, whether you are listing this year or just want to know where you stand.
Call me at 435-200-5508. You can also send me a message on my contact page. Open the contact form.